Investments in oil and gas, manufacturing, mining and electricity supply
Updated: 15 February 2024
Next update: Not yet determined
| Antatte investeringer registrert i 4. kvartal samme år | Antatte investeringer registrert i 4. kvartal året før | |||
|---|---|---|---|---|
| 2023 / 2022 | 2023 | 2024 / 2023 | 2024 | |
| Utvinning, rørtr., bergverk, industri og kraft | 22.2 | 291 572 | 37.6 | 302 991 |
| Utvinning og rørtransport | 23.4 | 216 266 | 55.0 | 232 037 |
| Industri | 25.6 | 44 894 | -10.6 | 35 922 |
| Bergverksdrift | 35.1 | 2 658 | 35.9 | 2 830 |
| Kraftforsyning | 8.0 | 27 754 | 13.9 | 32 202 |
| 1Verditallene er i løpende priser | ||||
Selected tables and charts from this statistics
- Antatte investeringer for neste år, etter næring og varetype. Millioner kronerDownload table as ...
 Antatte investeringer for neste år, etter næring og varetype. Millioner kroner1
Antatte investeringer Endringstall i mill. kr og prosent 2023 2024 2024 /2023 2024 /2024 4. kvartal året før 3. kvartal året før 4. kvartal året før Diff.2 Pst.2 Diff.3 Pst.3 Utvinning, rørtr., bergverk, industri og kraft 220 241 272 979 302 991 82 750 38 30 012 11 Utvinning og rørtransport 149 681 206 772 232 037 82 356 55 25 265 12 Utvinning av råolje og naturgass 148 475 204 262 229 568 81 093 55 25 306 12 Rørtransport 1 206 2 511 2 469 1 263 105 -42 -2 Industri og bergverksdrift 42 277 33 644 38 752 -3 525 -8 5 108 15 Bergverksdrift 2 082 2 023 2 830 748 36 807 40 Industri 40 195 31 621 35 922 -4 273 -11 4 301 14 Nærings-, drikkevare- og tob.ind 5 484 3 798 4 504 -980 -18 706 19 Næringsmiddelindustri 5 052 3 596 4 258 -794 -16 662 18 Tekstil-, bekledn.-, lærvareind. 338 113 191 -147 -43 78 69 Trelast- og trevareindustri 1 041 971 1 083 42 4 112 12 Papir- og papirvareindustri 464 287 338 -126 -27 51 18 Trykking, grafisk industri 104 48 69 -35 -34 21 44 Oljeraff., kjemisk, farmas. industri 6 447 9 912 8 984 2 537 39 -928 -9 Kjemiske råvarer 3 370 5 239 5 488 2 118 63 249 5 Gummi, plast, mineralsk industri mv. 6 254 2 552 3 851 -2 403 -38 1 299 51 Metallindustri 9 716 8 018 9 156 -560 -6 1 138 14 Ikke-jernholdige metaller 8 620 7 380 8 670 50 1 1 290 17 Metallvareindustri 1 590 1 359 1 485 -105 -7 126 9 Dataindustri og elektrisk utstyrsindustri 5 544 1 783 2 814 -2 730 -49 1 031 58 Maskinindustri 1 160 799 1 201 41 4 402 50 Bygging av skip og oljeplattformer 1 240 1 162 1 425 185 15 263 23 Annen verkstedsindustri 298 466 351 53 18 -115 -25 Maskinreparasjon og -installasjon 248 216 332 84 34 116 54 Møbelindustri og annen industri 269 138 137 -132 -49 -1 -1 Kraftforsyning 28 283 32 563 32 202 3 919 14 -361 -1 Produksjon av elektrisitet 6 379 6 983 8 244 1 865 29 1 261 18 Overf. og distribusjon av elektrisitet 18 880 21 090 21 539 2 659 14 449 2 Fjernvarme og annen kraftforsyning 3 024 4 491 2 420 -604 -20 -2 071 -46 Etter varetype: Innsatsvarer 30 669 22 957 27 211 -3 458 -11 4 254 19 Investeringsvarer 3 986 3 644 4 494 508 13 850 23 Konsumvarer 6 714 5 500 5 448 -1 266 -19 -52 -1 Varige konsumvarer 313 319 373 60 19 54 17 Ikke-varige konsumvarer 6 400 5 181 5 075 -1 325 -21 -106 -2 Energivarer 178 872 240 878 265 838 86 966 49 24 960 10 1Aggregeringsnivåene refererer seg til standard for næringsgruppering (SN2007). Se NOS D383 for nærmere om dette. 2Endring fra foregående år for antatte investeringer neste år, rapportert i 4. kvartal året før. 3Endring for antatte investeringer i neste år, rapportert i 3. kvartal året før og 4. kvartal året før. Explanation of symbolsDownload table as ... - Antatte investeringer inneværende år, etter næring og varetype. Millioner kronerDownload table as ...Antatte investeringer inneværende år, etter næring og varetype. Millioner kroner1
Antatte investeringer Endringstall i mill. kr og prosent 2022 2023 2023 /2022 2023 /2023 4. kvartal samme år 3. kvartal samme år 4. kvartal samme år Diff.2 Pst.2 Diff.3 Pst.3 Utvinning, rørtr., bergverk, industri og kraft 238 684 291 184 291 572 52 888 22 388 0 Utvinning og rørtransport 175 269 213 178 216 266 40 997 23 3 088 1 Utvinning av råolje og naturgass 174 629 211 651 214 766 40 137 23 3 115 1 Rørtransport 640 1 527 1 500 860 134 -27 -2 Industri og bergverksdrift 37 719 49 023 47 552 9 833 26 -1 471 -3 Bergverksdrift 1 967 3 026 2 658 691 35 -368 -12 Industri 35 753 45 997 44 894 9 141 26 -1 103 -2 Nærings-, drikkevare- og tob.ind 8 677 8 771 9 271 594 7 500 6 Næringsmiddelindustri 8 175 7 855 8 380 205 3 525 7 Tekstil-, bekledn.-, lærvareind. 208 299 298 90 43 -1 0 Trelast- og trevareindustri 1 273 1 456 1 552 279 22 96 7 Papir- og papirvareindustri 796 1 130 1 140 344 43 10 1 Trykking, grafisk industri 243 251 250 7 3 -1 0 Oljeraff., kjemisk, farmas. industri 6 488 5 703 5 486 -1 002 -15 -217 -4 Kjemiske råvarer 3 776 3 451 3 283 -493 -13 -168 -5 Gummi, plast, mineralsk industri mv. 2 701 4 591 4 282 1 581 59 -309 -7 Metallindustri 6 589 10 698 10 270 3 681 56 -428 -4 Ikke-jernholdige metaller 5 502 8 494 8 703 3 201 58 209 2 Metallvareindustri 1 358 1 557 1 611 253 19 54 3 Dataindustri og elektrisk utstyrsindustri 4 648 6 264 5 543 895 19 -721 -12 Maskinindustri 929 1 268 1 434 505 54 166 13 Bygging av skip og oljeplattformer 823 2 546 2 486 1 663 202 -60 -2 Annen verkstedsindustri 306 505 309 3 1 -196 -39 Maskinreparasjon og -installasjon 375 683 738 363 97 55 8 Møbelindustri og annen industri 340 276 225 -115 -34 -51 -18 Kraftforsyning 25 695 28 984 27 754 2 059 8 -1 230 -4 Produksjon av elektrisitet 7 432 6 956 6 155 -1 277 -17 -801 -12 Overf. og distribusjon av elektrisitet 16 580 19 413 19 270 2 690 16 -143 -1 Fjernvarme og annen kraftforsyning 1 683 2 615 2 329 646 38 -286 -11 Etter varetype: Innsatsvarer 22 795 32 531 30 719 7 924 35 -1 812 -6 Investeringsvarer 3 481 6 109 6 185 2 704 78 76 1 Konsumvarer 9 560 9 675 9 958 398 4 283 3 Varige konsumvarer 320 333 296 -24 -8 -37 -11 Ikke-varige konsumvarer 9 241 9 342 9 662 421 5 320 3 Energivarer 202 847 242 870 244 709 41 862 21 1 839 1 1Aggregeringsnivåene refererer seg til standard for næringsgruppering (SN2007). Se NOS D383 for nærmere om dette. 2Endring fra foregående år for antatte investeringer, rapportert i 4. kvartal samme år. 3Endring for antatte investeringer i inneværende år, rapportert i 3. kvartal samme år og 4. kvartal samme år. Explanation of symbolsDownload table as ... - Kvartalsvise utførte investeringer etter kostnadsart. Utvinning av råolje og naturgass, og rørtransport. Millioner kronerDownload table as ...Kvartalsvise utførte investeringer etter kostnadsart. Utvinning av råolje og naturgass, og rørtransport. Millioner kroner
3. kvartal 2022 4. kvartal 2022 1. kvartal 2023 2. kvartal 2023 3. kvartal 2023 Utvinning og rørtransport 43 687 48 847 45 349 51 192 56 434 Utvinning av råolje og naturgass 43 375 48 386 45 173 50 573 56 125 Leting og konseptstudier 7 631 6 876 5 664 5 486 5 970 Undersøkelsesboring 3 586 3 238 4 037 3 599 3 504 Generelle undersøkelser 1 111 1 084 681 998 1 510 Feltevaluering/feltutvikling 221 102 217 281 289 Administrasjon og andre kostnader 651 690 683 586 575 Konseptstudier 2 062 1 762 47 22 92 Feltutbygging 13 732 19 583 20 804 21 412 25 844 Varer, feltutbygging 5 905 7 017 7 357 7 255 8 731 Tjenester, feltutbygging 4 911 7 332 8 476 8 642 11 136 Produksjonsboring, feltutbygging 2 916 5 234 4 970 5 516 5 977 Felt i drift 19 442 20 306 17 291 21 242 22 144 Varer, felt i drift 1 709 1 978 1 728 2 240 2 153 Tjenester, felt i drift 5 060 6 559 4 798 6 335 6 209 Produksjonsboring, felt i drift 12 674 11 769 10 765 12 667 13 782 Landvirksomhet 825 980 727 884 825 Nedstengning og fjerning 1 744 640 686 1 549 1 342 Rørtransport 312 462 176 619 309 Explanation of symbolsDownload table as ... - Årlige utførte investeringer etter kostnadsart. Utvinning av råolje og naturgass, og rørtransport. Millioner kronerDownload table as ...Årlige utførte investeringer etter kostnadsart. Utvinning av råolje og naturgass, og rørtransport. Millioner kroner
2019 2020 2021 2022 2023 Utvinning og rørtransport 177 544 179 309 177 693 176 811 0 Utvinning av råolje og naturgass i alt 176 829 178 776 176 885 175 858 0 Leting og konseptstudier 27 757 21 432 27 308 28 407 0 Feltutbygging 77 667 76 497 62 434 62 257 0 Varer 35 651 32 260 23 341 25 260 0 Tjenester 30 090 26 765 22 766 21 930 0 Produksjonsboring 11 926 17 472 16 327 15 066 0 Felt i drift 65 420 72 032 75 295 75 028 0 Varer 4 124 4 166 7 658 6 614 0 Tjenester 14 796 13 478 14 886 20 940 0 Produksjonsboring 46 500 54 389 52 751 47 474 0 Landvirksomhet 2 054 1 919 4 064 4 160 0 Nedstengning og fjerning 3 930 6 896 7 785 6 006 0 Rørtransport 715 532 808 953 0 Explanation of symbolsDownload table as ... - Investeringer etter kostnadsart og registreringstidspunkt. Utvinning av råolje og naturgass, og rørtransport. Millioner kronerDownload table as ...Investeringer etter kostnadsart og registreringstidspunkt. Utvinning av råolje og naturgass, og rørtransport. Millioner kroner
2023 2024 Antatte investeringer februar året før Antatte investeringer mai året før Antatte investeringer august året før Antatte investeringer november året før Antatte investeringer februar samme år Antatte investeringer mai samme år Antatte investeringer august samme år Antatte investeringer november samme år Påløpte investeringer Antatte investeringer februar året før Antatte investeringer mai året før Antatte investeringer august året før Antatte investeringer november året før Antatte investeringer februar samme år Utvinning og rørtransport 131 420 130 601 135 320 149 681 187 831 0 0 0 0 178 547 0 0 0 0 Utvinning av råolje og naturgass i alt 129 999 129 554 134 274 148 475 186 626 0 0 0 0 176 046 0 0 0 0 Leting og konseptstudier 26 538 23 236 19 799 20 029 21 398 0 0 0 0 26 660 0 0 0 0 Feltutbygging 41 366 41 713 44 624 50 191 86 752 0 0 0 0 85 213 0 0 0 0 Varer 11 513 13 251 11 412 19 888 30 868 0 0 0 0 22 177 0 0 0 0 Tjenester 14 046 7 958 10 101 8 136 32 358 0 0 0 0 39 732 0 0 0 0 Produksjonsboring 15 807 20 505 23 112 22 167 23 525 0 0 0 0 23 305 0 0 0 0 Felt i drift 55 367 57 419 61 717 69 164 70 071 0 0 0 0 56 413 0 0 0 0 Varer 6 980 7 109 8 900 11 155 9 154 0 0 0 0 6 695 0 0 0 0 Tjenester 14 605 16 007 18 675 20 343 20 388 0 0 0 0 18 108 0 0 0 0 Produksjonsboring 33 782 34 303 34 142 37 667 40 528 0 0 0 0 31 609 0 0 0 0 Landvirksomhet 3 287 3 342 3 306 4 757 3 613 0 0 0 0 2 668 0 0 0 0 Nedstengning og fjerning 3 441 3 845 4 827 4 334 4 793 0 0 0 0 5 093 0 0 0 0 Rørtransport 1 421 1 046 1 047 1 206 1 204 0 0 0 0 2 500 0 0 0 0 Explanation of symbolsDownload table as ... - Utførte investeringer per kvartal. Sesongjusterte serier. 2005=100Download table as ...Utførte investeringer per kvartal. Sesongjusterte serier. 2005=100
1. kvartal 2023 2. kvartal 2023 3. kvartal 2023 Endring i prosent 1. kvartal 2023 / 4. kvartal 2022 2. kvartal 2023 / 1. kvartal 2023 3. kvartal 2023 / 2. kvartal 2023 Utvinning, rørtr., bergverk, industri og kraft 231.6 231.2 250.3 8.2 -0.2 8.3 Utvinning og rørtransport 217.1 222.7 248.3 5.2 2.6 11.5 Industri og bergverksdrift 252.3 238.1 250.4 22.4 -5.6 5.2 Bergverksdrift 370.8 439.7 319.6 21.3 18.6 -27.3 Industri 248.9 230.9 247.2 24.2 -7.2 7.1 Kraftforsyning 319.3 298.9 309.1 4.7 -6.4 3.4 Explanation of symbolsDownload table as ... - Investeringer. Utvinning, rørtransport, bergverk, industri og kraft. Millioner kroner og i prosent av utførte investeringerDownload table as ...Investeringer. Utvinning, rørtransport, bergverk, industri og kraft. Millioner kroner og i prosent av utførte investeringer
Antatte investeringer registrert året før Antatte investeringer registrert samme år Utførte investeringer Mai Aug. Nov. Feb. Mai Aug. Nov. 2002 51 171 61 067 74 685 81 932 85 054 85 338 84 032 80 800 2003 72 377 75 939 84 247 94 808 94 187 92 708 90 927 89 374 2004 78 671 87 713 87 194 89 650 97 891 101 728 99 268 98 933 2005 76 843 99 706 114 010 117 303 121 383 119 176 117 022 118 339 2006 90 224 102 912 121 637 124 519 134 864 132 769 133 551 128 781 2007 96 497 116 861 135 293 146 311 153 731 162 314 155 112 152 223 2008 116 624 156 622 169 953 178 519 182 483 180 798 179 667 177 730 2009 153 043 169 478 185 041 177 930 188 749 187 810 183 790 177 455 2010 172 418 183 756 178 668 176 049 179 705 181 242 173 806 166 173 2011 185 411 190 180 193 175 185 749 188 663 197 689 196 777 190 174 2012 183 094 214 269 228 617 233 334 234 233 232 823 226 689 219 391 2013 237 873 249 267 252 011 246 769 260 876 263 899 262 848 260 241 2014 263 659 271 299 280 514 283 956 285 356 280 884 271 700 268 439 2015 231 091 234 705 242 309 245 639 245 729 249 127 248 864 244 907 2016 238 839 235 208 227 596 222 246 220 445 218 941 219 921 214 503 2017 202 320 199 319 196 832 204 998 211 776 211 971 205 216 202 187 2018 196 240 194 321 203 690 225 953 221 597 224 048 221 546 217 401 2019 210 677 225 723 240 978 244 754 258 862 256 805 256 770 249 663 2020 227 932 230 564 243 807 255 113 246 701 251 757 250 604 246 223 2021 193 604 199 505 221 884 235 185 243 375 244 341 242 986 237 153 2022 188 760 189 604 209 303 224 681 231 167 238 347 238 684 238 249 2023 186 258 196 077 220 241 267 291 275 957 291 184 291 572 . 2024 247 375 272 979 302 991 . . . . . Pst. 2002 63 76 92 101 105 106 104 100 2003 81 85 94 106 105 104 102 100 2004 80 89 88 91 99 103 100 100 2005 65 84 96 99 103 101 99 100 2006 70 80 94 97 105 103 104 100 2007 63 77 89 96 101 107 102 100 2008 66 88 96 100 103 102 101 100 2009 86 96 104 100 106 106 104 100 2010 104 111 108 106 108 109 105 100 2011 97 100 102 98 99 104 103 100 2012 83 98 104 106 107 106 103 100 2013 91 96 97 95 100 101 101 100 2014 98 101 104 106 106 105 101 100 2015 94 96 99 100 100 102 102 100 2016 111 110 106 104 103 102 103 100 2017 100 99 97 101 105 105 101 100 2018 90 89 94 104 102 103 102 100 2019 84 90 97 98 104 103 103 100 2020 93 94 99 104 100 102 102 100 2021 82 84 94 99 103 103 102 100 2022 79 80 88 94 97 100 100 100 2023 . . . . . . . . 2024 . . . . . . . . Explanation of symbolsDownload table as ... - Investeringer. Utvinning og rørtransport. Millioner kroner og i prosent av utførte investeringerDownload table as ...Investeringer. Utvinning og rørtransport. Millioner kroner og i prosent av utførte investeringer
Antatte registreringer registrert året før Antatte investeringer registrert samme år Utførte investeringer Feb. Mai Aug. Nov. Feb. Mai Aug. Nov. 2002 29 332 38 915 50 396 56 685 58 193 59 490 58 413 54 940 2003 52 631 56 066 61 733 71 985 70 227 67 790 66 755 65 218 2004 59 275 67 917 64 310 65 091 72 379 75 155 73 127 72 665 2005 60 031 80 815 91 559 90 542 94 034 90 724 89 201 90 543 2006 66 355 79 494 94 023 95 106 103 547 100 905 101 193 97 014 2007 65 922 72 259 92 497 104 146 108 592 114 735 121 129 116 238 113 852 2008 75 919 85 565 122 535 130 287 134 197 136 766 133 400 131 983 129 354 2009 97 170 121 953 136 785 148 952 141 599 149 245 148 061 145 817 140 519 2010 92 163 140 275 150 104 143 697 140 887 145 448 145 644 139 384 131 839 2011 112 338 150 734 153 680 155 881 146 684 150 104 157 766 159 388 153 241 2012 109 593 147 526 176 259 190 197 191 274 191 544 190 681 186 843 179 322 2013 128 158 201 501 211 596 214 740 205 893 219 668 221 795 221 289 218 659 2014 164 325 224 203 231 918 240 175 240 758 241 387 237 056 228 241 224 402 2015 188 423 192 967 195 426 199 054 199 061 200 262 203 736 204 297 201 191 2016 175 770 192 477 188 878 179 204 171 759 169 896 168 739 170 280 164 492 2017 158 501 154 905 152 194 146 643 149 404 154 381 155 627 150 842 148 809 2018 121 502 143 970 141 748 144 333 160 010 156 454 156 313 155 457 151 831 2019 145 403 155 509 165 100 175 251 172 711 183 738 181 733 182 929 177 544 2020 158 463 172 380 174 817 182 639 185 427 180 296 184 573 182 511 179 309 2021 151 990 145 575 148 614 166 270 173 584 181 854 181 541 182 275 177 672 2022 138 516 142 778 142 011 154 381 159 504 167 237 172 760 175 269 176 811 2023 131 420 130 601 135 320 149 681 187 831 197 783 213 178 216 266 . 2024 178 547 181 923 206 772 232 037 . . . . . Pst. 2002 53 71 92 103 106 108 106 100 2003 81 86 95 110 108 104 102 100 2004 82 93 89 90 100 103 101 100 2005 66 89 101 100 104 100 99 100 2006 68 82 97 98 107 104 104 100 2007 58 63 81 91 95 101 106 102 100 2008 59 66 95 101 104 106 103 102 100 2009 69 87 97 106 101 106 105 104 100 2010 70 106 114 109 107 110 110 106 100 2011 73 98 100 102 96 98 103 104 100 2012 61 82 98 106 107 107 106 104 100 2013 59 92 97 98 94 100 101 101 100 2014 73 100 103 107 107 108 106 102 100 2015 94 96 97 99 99 100 101 102 100 2016 107 117 115 109 104 103 103 104 100 2017 107 104 102 99 100 104 105 101 100 2018 80 95 93 95 105 103 103 102 100 2019 82 88 93 99 97 103 102 103 100 2020 88 96 97 102 103 101 103 102 100 2021 86 82 84 94 98 102 102 103 100 2022 78 81 80 87 90 95 98 99 100 2023 . . . . . . . . . 2024 . . . . . . . . . Explanation of symbolsDownload table as ... - Investeringer. Industri. Millioner kroner og i prosent av utførte investeringerDownload table as ...Investeringer. Industri. Millioner kroner og i prosent av utførte investeringer
Antatte investeringer registrert året før Antatte investeringer registrert samme år Utførte investeringer Mai Aug. Nov. Feb. Mai Aug. Nov. 2002 15 828 16 032 16 884 18 560 19 986 19 348 19 172 19 324 2003 14 208 14 273 15 950 14 928 15 572 16 211 16 078 15 859 2004 12 855 12 950 15 399 15 685 15 805 16 788 16 758 16 723 2005 10 636 11 883 14 356 16 740 17 506 18 416 18 101 18 725 2006 13 743 14 290 17 437 17 302 19 791 20 250 20 765 20 845 2007 14 744 14 957 19 139 23 668 24 509 26 277 26 174 25 707 2008 20 014 22 763 27 365 30 279 30 854 32 172 32 377 32 861 2009 19 885 21 701 23 734 22 503 24 485 23 899 22 630 21 871 2010 17 201 17 740 18 404 19 341 18 533 18 943 18 256 17 959 2011 15 345 15 999 17 921 18 883 18 822 19 758 18 955 18 849 2012 15 271 16 476 17 496 18 717 19 597 19 787 19 160 19 463 2013 14 573 15 728 15 940 17 464 19 008 19 648 19 166 19 442 2014 15 002 15 196 17 088 18 861 20 070 20 345 20 129 20 891 2015 12 789 14 365 17 862 20 105 19 780 20 371 20 040 19 748 2016 18 198 19 355 21 052 21 755 22 524 22 300 21 923 23 179 2017 16 600 15 720 17 992 21 103 22 033 21 726 21 151 21 403 2018 17 415 17 441 20 839 23 608 23 742 24 645 23 686 24 312 2019 20 038 21 675 26 609 30 779 31 885 33 241 32 059 31 157 2020 19 936 21 357 24 479 26 826 25 888 25 539 26 859 26 433 2021 15 690 17 183 20 524 25 221 25 774 26 869 26 451 27 522 2022 18 594 21 286 27 865 34 753 35 619 36 150 35 753 35 251 2023 28 466 32 775 40 195 45 759 44 365 45 997 44 894 . 2024 30 294 31 621 35 922 . . . . . Pst. 2002 82 83 87 96 103 100 99 100 2003 90 90 101 94 98 102 101 100 2004 77 77 92 94 95 100 100 100 2005 57 63 77 89 93 98 97 100 2006 66 69 84 83 95 97 100 100 2007 57 58 74 92 95 102 102 100 2008 61 69 83 92 94 98 99 100 2009 91 99 109 103 112 109 103 100 2010 96 99 102 108 103 105 102 100 2011 81 85 95 100 100 105 101 100 2012 78 85 90 96 101 102 98 100 2013 75 81 82 90 98 101 99 100 2014 72 73 82 90 96 97 96 100 2015 65 73 90 102 100 103 101 100 2016 79 84 91 94 97 96 95 100 2017 78 73 84 99 103 102 99 100 2018 72 72 86 97 98 101 97 100 2019 64 70 85 99 102 107 103 100 2020 75 81 93 101 98 97 102 100 2021 57 62 75 92 94 98 96 100 2022 53 60 79 99 101 103 101 100 2023 . . . . . . . . 2024 . . . . . . . . Explanation of symbolsDownload table as ... - Investeringer. Kraftforsyning. Millioner kroner og i prosent av utførte investeringerDownload table as ...Investeringer. Kraftforsyning. Millioner kroner og i prosent av utførte investeringer
Antatte investeringer registrert året før Antatte investeringer registrert samme år Utførte investeringer Mai Aug. Nov. Feb. Mai Aug. Nov. 2002 5 702 5 762 7 113 6 303 6 486 6 133 6 131 6 215 2003 5 102 5 227 6 140 7 504 7 946 8 227 7 662 7 881 2004 6 099 6 477 7 145 8 441 9 074 9 065 8 772 8 931 2005 5 963 6 687 7 854 9 476 9 156 9 259 8 959 8 325 2006 9 865 8 864 9 913 11 790 11 154 11 179 10 809 10 248 2007 9 273 9 085 11 653 13 536 13 894 14 279 12 022 11 918 2008 10 823 10 997 11 912 13 141 13 799 14 153 14 276 14 442 2009 9 858 9 798 11 989 12 927 12 958 13 268 13 017 12 606 2010 14 042 15 393 16 310 14 459 14 653 15 058 14 467 14 612 2011 18 963 20 136 18 397 18 881 18 735 19 015 17 297 16 873 2012 19 615 20 736 19 974 22 272 21 696 20 898 19 356 19 178 2013 21 118 21 351 20 291 22 218 20 681 20 902 20 674 20 422 2014 23 178 23 165 22 162 22 857 22 495 22 181 21 916 21 677 2015 24 698 24 227 24 588 25 322 24 783 24 137 23 597 23 114 2016 27 533 26 328 26 630 28 100 27 345 27 213 27 123 26 222 2017 30 402 30 938 31 616 33 977 34 780 34 034 32 688 31 396 2018 34 355 34 567 37 738 41 168 40 032 41 737 41 112 39 981 2019 34 409 38 069 38 412 39 849 41 684 39 961 39 939 38 963 2020 33 415 33 155 35 198 40 719 38 877 39 792 39 601 38 576 2021 28 745 30 151 32 773 34 712 33 841 33 695 32 312 29 843 2022 24 322 23 094 24 756 27 627 26 355 27 336 25 695 24 252 2023 25 534 26 103 28 283 31 613 30 618 28 984 27 754 . 2024 32 142 32 563 32 202 . . . . . Pst. 2002 92 93 114 101 104 99 99 100 2003 65 66 78 95 101 104 97 100 2004 68 73 80 95 102 102 98 100 2005 72 80 94 114 110 111 108 100 2006 96 86 97 115 109 109 105 100 2007 78 76 98 114 117 120 101 100 2008 75 76 82 91 96 98 99 100 2009 78 78 95 103 103 105 103 100 2010 96 105 112 99 100 103 99 100 2011 112 119 109 112 111 113 103 100 2012 102 108 104 116 113 109 101 100 2013 103 105 99 109 101 102 101 100 2014 107 107 102 105 104 102 101 100 2015 107 105 106 110 107 104 102 100 2016 105 100 102 107 104 104 103 100 2017 97 99 101 108 111 108 104 100 2018 86 86 94 103 100 104 103 100 2019 88 98 99 102 107 103 103 100 2020 87 86 91 106 101 103 103 100 2021 96 101 110 116 113 113 108 100 2022 100 95 102 114 109 113 106 100 2023 . . . . . . . . 2024 . . . . . . . . Explanation of symbolsDownload table as ...
More figures from this statistics
- 07155: Investment Statistics. Extraction, pipeline, mining, manuf. and electricity Supply (NOK million), SIC2007
- 08147: Investment Statistics. Extraction, pipeline, mining, manuf. and electricity Supply. Seasonally adjusted (2005=100), SIC2007
- 08050: Estimated and accrued investments for oil and gas extraction and pipeline transport, by type of investment and estimation moment/accrued (NOK million)
- 04170: Accrued investments. Extraction of crude petroleum and natural gas and pipeline transport, by investment category (NOK million)
- 09602: Accrued investments. Extraction of crude petroleum and natural gas, and pipeline transport, by investment category (NOK million)
About the statistics
The survey monitors the development in estimated and final investments within oil and gas activities, manufacturing, mining & quarrying and electricity supply.
The information under «About the statistics» was last updated 5 December 2022.
Enterprise: The smallest combination of legal units that is an organisational unit producing goods or services and that benefits from a certain degree of autonomy in decision making.
Local unit (establishment): An enterprise or part of an enterprise that is located in one particular place and thus can be identified geographically.
Investment: All acquisitions of new fixed assets with a lifetime of more than one year. The acquisitions must be reported in the period they are made even if they are not been paid for or activated in the accounts. Value added tax (VAT) is reported in net value, i.e. refunded VAT should not be included, but VAT that is not refunded should. Fixed assets acquired from financial leasing are to be included.
Estimated investments: Acquisitions that the establishment plans to make throughout the present quarter and in the short and medium run.
Final investments: Acquisitions that the establishment has made throughout the previous quarter. The concept of final investments does not necessarily imply that the acquired material is put to use.
Machinery: All types of permanent mechanical and electrical equipment, i.e. machinery (including industrial furnaces), transformers, computers (hardware and software), instruments and parts (including installation) plus tools that have a lifetime of several years.
Cars and other means of transport: All types of vehicles, industrial railways, telpher lines, cranes and other means of transport.
Buildings and constructions (manufacturing, mining and quarrying): Manufacturing plants, workshops, storehouses, office buildings, social welfare installations (not houses), docks, silos, mines, quarries, roads, foundations, tunnels, dams, power lines, pipelines etc. except fall rights and the site value. Major repairs and reconstruction projects are also to be included.
Definitions of main concepts, especially related to oil and gas activity:
Exploration:Covers the activity from when the production licence is given until the exploration programme is finished or the licence is returned.
Development: Covers the activity from the time commercial development is approved by the Parliament to start of production, inclusive establishment of the on stream organisation and production drilling.
Production: Covers the activity after the start of production, inclusive production drilling.
Shutdown and removal: Covers the activity related to permanent shutdown fields and wells, inclusive activity performed prior to the shutdown of a field.
Ancillary activity/Onshore activity: Covers the activity in offices and bases onshore; administrative and technical services both to own activity as operator and interests in other production licenses.
The survey is classified according to the Standard Industrial Classification 2007 (SIC2007). This is a Norwegian adaptation of Eurostat’s industry classification, NACE Rev. 2. SIC2007. The use of common standards is essential in order to enable the comparison and analysis of statistical data at an international level and over time.
The survey is also classified according to EUROSTAT's end-use categories (Main Industrial Groupings). The end-use categories are based on the 3-digit level industrial groupings in SIC2007. Six end-use categories are included in the survey:
MIG code | Description |
E1 | Intermediate goods |
E2 | Capital goods |
E3 | Consumer durables |
E4 | Consumer non-durables |
E5 | Consumer goods (E3+E4) |
E6 | Energy goods |
The following table summarises the most important industries included in the different end-use categories:
MIG | Main industries included |
Intermediate goods | Wood and wood products, Paper and paper products, Basic chemicals, Rubber and plastics products, Non-metallic mineral products, Basic metals |
Capital goods | Machinery and equipment, Building of ships, boats and oil platforms, Repair and installation of machinery |
Consumer durables | Manufacture of furniture |
Consumer non-durables | Food products, Printing and reproduction, Basic pharmaceuticals |
Consumer goods (E3+E4) | Manufacture of furniture, Food products, Printing and reproduction, Basic pharmaceuticals |
Energy goods | Mining of coal, Extraction of oil and gas, pipeline transport, Refined petroleum products, Electricity, gas and steam supply |
For a complete description of the industries covered by each MIG, see Commission regulation (EC) No 656/2007 or KLASS in the following link: https://www.ssb.no/en/klass/klassifikasjoner/6/varianter/1121.
Name: Investments in oil and gas, manufacturing, mining and electricity supply
Topic: Energy and manufacturing
Division for Business Cycle Statistics
National level only
Published quarterly about 8 weeks after the end of the quarter for final investments. First estimates for the current year are published in the 1st quarter and are based entirely on estimates. Annual estimates for the current year are updated quarterly in 2nd, 3rd and 4th quarter based on final investments in the previous quarter as well as updated estimates for current quarter and the rest of the year. Final annual investments are published 1st quarter the following year. Estimates for next year are published the first time in 2nd quarter the year before, and are updated in 3rd and 4th quarter the year before.
Not relevant
Non-revised and revised micro data are stored in accordance with Statistics Norway's guidelines for storing of computer files.
The survey monitors the development in estimated and final investments within oil and gas activities, manufacturing, mining & quarrying and electricity supply in order to provide information about domestic demand for capital goods. The survey is financed by government appropriations.
From the Q3 publication in 2015, the statistics on investments in manufacturing, mining and quarrying and electricity supply (KIS) is merged with the statistics on oil and gas activities, investments (OLJEINV). The combined statistics will provide a more comprehensive presentation of final and planned investments for oil and gas, manufacturing, mining and quarrying and electricity supply.
The two merged statistics have the same conceptual build-up, regarding press release and analysis.
On a quarterly basis, both statistics provide figures for actual investments made in the previous quarter, as well as updated annual estimates for the current and the next year. However, the two statistics are quite different when it comes to the collection of data and in the formula build-up. In the statistics on oil and gas activities all active enterprise are included in the statistical sample; in other words the sample is identical to the population. Statistics on investments in manufacturing, mining and quarrying and electricity supply (KIS), on the other hand, is based on sample of the population.
Before the merger, the statistics on oil and gas activities, investments (OLJEINV) has been published quarterly since 1984, while statistics on investments in manufacturing, mining and quarrying and electricity supply (KIS) has been published quarterly since 1973.
Large revisions in oil and gas activity:
As
of 2014 the category shutdown and removal was included in the statistics for oil and gas activities, investments. Until the statistical year 2012 this category was collected annually as a part of the current expenditure costs for the oil and gas industry. In accordance with international guideline changes the Norwegian annual national account regards these types of costs as an investment, as of the main revision 2014. In order to maintain accordance with the annual national account these costs were thus included in the statistics for oil and gas activities, investments. Figures going back to 2002 were also moved to the investment statistics.
Shutdown and removal also includes permanent shutdown (plugging) of wells. In the annual statistic, until the statistical year 2013, these costs were only collected for fields which where actually shut down. As of 2013 these costs are also collected for all active fields, since permanent shut down of wells may be performed while the field is still in production. Thus these types of costs are now collected by a larger population than before the revision. Hence, the figures for removal and shutdown before and after 2013 are not comparable. However, it may also be the case that costs related to shut down of wells which were not reported as shut down and removal before 2013 may have been included as production drilling investments under the category production.
In 2015 a revision of the questionnaires for oil and gas activities, investments was performed. Most of the questionnaires were simplified by removing some of the sub- cost categories.
Large revisions in manufacturing, mining and quarrying and electricity supply:
In Q2 2000 there was a comprehensive revision of the survey. The coverage was improved, and the industrial classification was revised for individual establishments. As from Q1 2004 results are estimated for the entire population. Prior to Q1 2004 the statistics was based on results for a sample of approximately 1900 establishments. High coverage and a high response rate were the incentives for using this simple form of aggregation.
As from Q1 2009 all results will refer to SIC2007. Historical series have been recalculated according to this version of SIC, and results dating back to 1995, or in some cases 1990, are available in the Statbank database. Historical series based on SIC2002 are still available in the Statbank database, but they will not be updated.
Internal users include statistics like the Quarterly National Accounts and the Economic Trends for Norway and Abroad . The results are also used in economic research.
External users include mass media, banks and financial institutions, public institutions like the Ministry of Finance and the National Bank of Norway etc.
No external users have access to the statistics and analyses before they are published and accessible simultaneously for all users on ssb.no at 8 am. Prior to this, a minimum of three months' advance notice is given inthe Statistics Release Calendar. This is one of Statistics Norway’s key principles for ensuring that all users are treated equally.
Results from the quarterly investment statistics are used by the Quarterly National Accounts to forecast the level of annual investments.
Investment statistics are also available in the annual structural business surveys for oil and gas activities , manufacturing, mining & quarrying , electricity supply and district heating. This data is also included in the build- up of the National Accounts
Oil and gas activity:
The information is collected by Statistics Norway on behalf of Norwegian Petroleum Directorate authorized in law by the Act of 29 November 1996 No. 72 relating to petroleum activities. Statistics Norway makes use of the information in preparation of official statistics, authorized in law by The Statistics Act of 1989.
Manufacturing, mining and electricity supply:
The Statistics Act of 21st of June 2019, §10 and §20
Not relevant.
The statistics covers mining and quarrying (05, 07, 08, 09.9), manufacturing (10-33) and electricity supply (35), extraction of crude oil and natural gas (06) as well as pipeline transport (49.5), see Standard Industrial Classification 2007(SIC2007). The population is defined by the Central Register of Establishments and Enterprises, and establishment is used as observation unit since it has a more delineated and homogenous activity than an enterprise.
Manufacturing, mining and electricity supply:
The survey uses information from the Central Register of Establishments and Enterprises and investment data collected by questionnaire from the observation units included in the sample. Annual structural data for manufacturing, mining & quarrying and annual structural data for electricity supply are used to inflate the results to population level.
The gross sample includes about 1850 establishments and represents 9 per cent of the population. The observation units cover 80 per cent of the total level of investment for the industries covered by the survey.
The sample includes all establishments with 100 employees or more. Large investment projects in industries covered by the survey are also included. The remaining units are drawn by using a method based on stratification and optimal allocation with probability proportional to the size of the unit measured by the number of employees.
In principle, establishments with less than 10 employees are not included in the survey, but some exceptions are made. This can be newly started establishments which have not yet registered employment figures, units within electricity supply which have inadequate employment figures and units in industries whit very few numbers of establishments.
Strata (employees) | Sample | Distribution strata 2 - 5 | Method |
1 - (> 100) | 401 | Cut-off | |
2 - (50-99) | 414 | 28,3 | PPS |
3 - (20-49) | 629 | 43,1 | PPS |
4 - (10-19) | 307 | 21,0 | PPS |
5 - (< 10) | 111 | 7,6 | Cut-off |
1862 |
Oil and gas activity:
For extraction of crude oil (06.100), extraction of natural gas (06.200) and pipeline transport (49.500) questionnaires are filled out by operators with extraction licenses. For these industries all active enterprises are included in the survey; the sample is identical to the population.
Manufacturing, mining and electricity supply:
The survey is based on data collected by questionnaires. The questionnaires are returned electronically via Altinn. The questionnaires are available in Altinn in the middle of the first month of each quarter for the first, second and fourth quarter. For the third quarter, the questionnaires are available at the end of June.
The deadline for returning the questionnaire is normally in the beginning of February, May, August and November. Respondents who fail to return the questionnaire receive a compulsory fine 5 days after the deadline, whereupon a new deadline of 7-9 days is set.
The questionnaires are downloaded from Altinn, and the data are automatically checked for duplicates and errors in totals. The results are also checked for deviations from data collected in previous quarters. When there are considerable deviations the establishment is contacted. Editing on an aggregated level is conducted by assessing the development over time, and unacceptable series lead to further editing of the data. Comparisons with annual structural statistics for manufacturing, mining & quarrying, electricity supply and district heating are also carried out.
Results are inflated to population level by using a ratio estimator. Investment data from the annual structural statistics for manufacturing, mining & quarrying and for electricity supply are used for calculating the ratios. The population and the sample are divided into sub-groups prior to estimation, first by grouping the establishments into publication levels approximately equal to 2-digit NACE (SIC2007) and then by stratifying the publication levels. The size of the establishment's average investments as registered in the annual structural statistics is used as stratification variable. Results from the three most recent annual surveys are used for calculating average investments.
Estimates are made for each publication level * stratum. The largest projects are not included in the estimation, but are added to the results to calculate the total level of investment within each publication level. Totals for mining & quarrying, manufacturing and electricity supply are created by summarising the estimates.
Oil and gas activity:
Figures for accrued and estimated investments in the oil and gas activity are collected for a number of goods and services. The accrued investment costs are requested. The investments contain the industry sector`s extraction of crude oil and natural gas, and pipeline transport (06.100, 06.200, 49.50) and are divided into investments for exploration, field development, fields on stream, shutdown and removal onshore activities and pipeline transport.
The data is collected by an electronic file transfer system (MoveIT), and the respondents are licence operators on the Norwegian continental shelf.
The data are automatically checked for duplicates and errors in totals. The results are also checked for deviations from data collected in previous quarters. When there are considerable deviations the establishment is contacted. Editing on an aggregated level is conducted by assessing the development over time, and unacceptable series lead to further revision of the data.
Quarterly investment figures on oil and gas activity are also seasonally adjusted as of Q3 2015.
Time series sometimes contain significant seasonal variation that makes it difficult to interpret the results from one period to another. This problem is solved with the help of sesonal adjustment. The Quarterly Investment Statistics uses X12-ARIMA to calculate seasonally adjusted figures and smoothed seasonally adjusted figures. For further information, please see the section About seasonal adjustment.
Confidential micro data: According to §8 of the Statistics Act of 21st of June 2019 nr.32, collected data are subject to secrecy and are to be kept or destroyed in a secure manner. Any use of the data must be in accordance with the rules set out by the Data Inspectorate.
Time series that are not to be published: The publication of data is subject to the provisions in §7 of Statistics Act of 21st of June 2019 nr.32. The main rule is that data should not be published if they can be traced back to the respondent, i.e. figures for which less than three respondents make up the foundation for a cell in the table, figures where one respondent represents more than 90 per cent of the total value or figures where two respondents represent at least 95 per cent of the total value. In the Quarterly Investment Statistics this is the case in sector 05, 12 and 19 (SIC2007).
Unpublished data: Revised data which are not published are subject to secrecy. This implies that they are unavailable to Statistics Norway's employees without distinct approval.
As from Q1 2009, SIC2002 is replaced by SIC2007 (chapter 2.1). Users must ensure that they use results based on the same version of SIC when making comparisons over time. Historical series based on SIC2002 are available in the Statbank database for 1989 to 2008.
Measurement errors are caused by the questionnaire or the respondent’s internal systems for obtaining the data. One source of measurement errors may be ambiguous guidelines. Great effort is put into avoiding this kind of errors, and the introduction of electronic data collection has reduced the scope of measurement errors by integrating logical controls in the questionnaires.
Processing errors may occur when Statistics Norway process the data. Typical examples are misinterpretations, or when correct answers are assumed to be false and corrected. Electronic data collection through Altinn has reduced these kinds of errors.
Errors of non-response refer to errors that either occurs due to missing questionnaires or blank boxes in the questionnaire. The response rate when the deadline expires is around 97 per cent for manufacturing, mining and electricity supply, and 99.5 per cent for oil and gas activity. Critical units, i.e. units that have a considerable impact on the results on a detailed level aggregation (2-digit NACE), are contacted by telephone. Calculations of the effect of missing units have been done, but so far any evidence of skewness has not been uncovered. Missing questionnaires for manufacturing, mining and electricity supply are imputated by the use of figures from previous surveys (cold-deck). Boxes in the questionnaire that are left blank (partial non-response) are treated as zero. This is not always correct. In general, it is difficult to identify this type of errors, and a great deal of effort is put into securing the quality of the data from units with a considerable effect on the overall level of investment within a single industry.
Sampling errors refer to uncertainty that occur in sample surveys as opposed to a full count. The sample variance equals the expected deviation between a sample survey and a full count. In order to ensure a high degree of relevance at the lowest cost possible, great effort is put into including all large units in the population in the sample. Calculations of the size and significance of this type of error have not yet been carried out. Establishments that close down may be a source of skewness if the proportion of close downs in the sample deviates from the population. The quarterly investment statistics is based on a fixed sample (panel). Periodic updates of the sample ensure that this is in accordance with the population. Sampling errors are not relevant for oil and gas activity since all active units are included in the survey; i.e the sample is identical to the population.
Coverage errors refer to errors in the registers that define the population. As a result, units may be incorrectly included in or excluded from the population. This is usually due to misleading or insufficient information at a certain time. Calculations of the size and significance of such errors have not yet been carried out. However, such errors are not considered to be greater than for other quantitative short-term statistics. Annual revisions of the industry classification for the sample units are performed around Q2 every year in order to ease these types of errors.
Modelling errors are first and foremost related to problems with seasonal adjustment of time series. Such problems are caused by deviation from the conditions that form the basis for the model used. Typical problems are related to movable public holidays such as Easter. However, such problems are considered greater for surveys published on a monthly basis. X12-ARIMA generates a number of indicators that are used to evaluate the quality of the seasonal adjustment. These indicators have identified a stable seasonal pattern for manufacturing, electricity supply and oil and gas activities. However, this is not the case for mining and quarrying.
Nor relevant
What is seasonal adjustment?
Monthly and quarterly time series are often characterised by considerable seasonal variations, which might complicate their interpretation. Such time series are therefore subjected to a process of seasonal adjustment in order to remove the effects of these seasonal fluctuations. Once data have been adjusted for seasonal effects by X-12-ARIMA or some other seasonal adjustment tool, a clearer picture of the time series emerges.
For more information on seasonal adjustment: metadata on methods: seasonal adjustment
Why do we seasonally adjust statistics on quarterly investments in oil and gas, manufacturing, mining and electricity supply?
The statistics on quarterly investments in oil and gas, manufacturing, mining and electricity supply is part of a system of short-term statistics compiled to monitor the economy. The primary goal of the survey is to monitor the development in actual and estimated investments as they are important indicators on the demand for capital goods in the economy.
Historical data reveal that time series on quarterly investments in oil and gas, manufacturing, mining and electricity supply have a clear seasonal pattern (see chart), and this might complicate the interpretation of the time series from quarter to quarter.
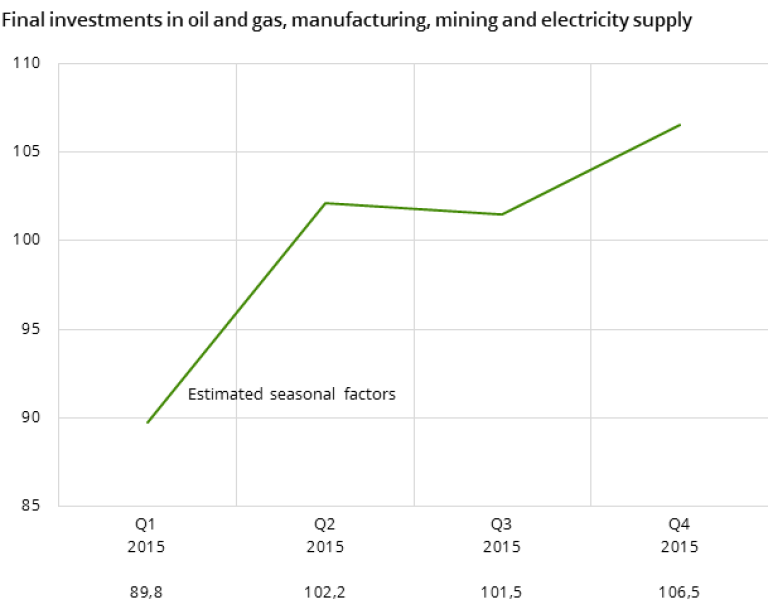
However, it is possible to adjust for this type of seasonal variations (see chart).
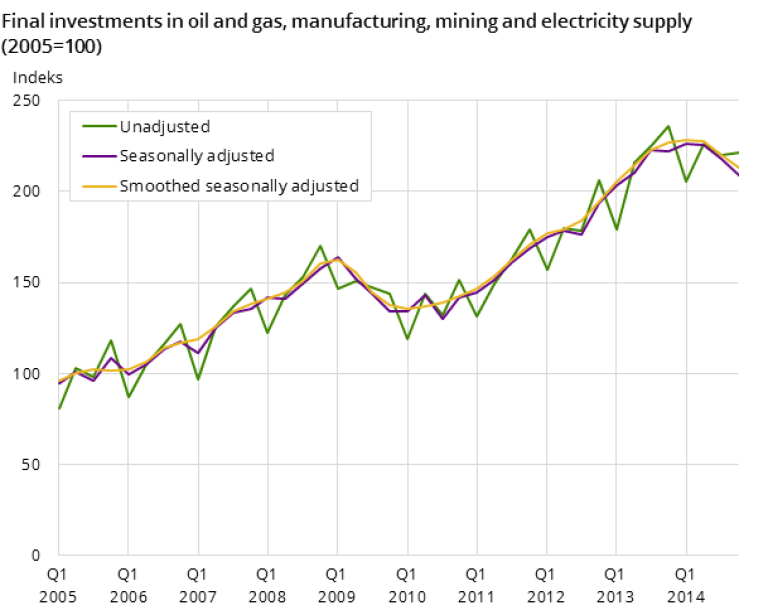
The seasonal factors (chart 1) show that quarterly investments seem to be low in the first quarter and high in the fourth quarter. The estimates for the second and the third quarter lie in between the two extremes and more or less share the same value. The stable seasonal pattern in the unadjusted series indicates a low degree of white noise. This conclusion is supported by the small gap between the seasonally adjusted time series and the smoothed seasonally adjusted time series (trend).
No empirical studies are conducted to explain the seasonal pattern for quarterly investments in oil and gas, manufacturing, mining and electricity supply. However, years of experience has shown that the following factors are possible sources of seasonal variations.
Seasonal variations
Temperatures and weather conditions seem to influence investment behaviour.
The nature of projects
Projects (particularly in manufacturing and electricity supply) often start at the beginning of the year and are scheduled to be finished within twelve months. Investments are most likely to be low in the initial phase of a project. The reason for this is that the groundwork often costs substantially less than new machinery and equipment.
Accounting principles
Some of the smaller establishments choose to report total investments in the fourth quarter of the year. This is against the guidelines, but can be explained by a lack of proper tools for making budgets and measure costs.
Seasonally adjusted time series
Seasonally adjusted time series are published for estimated and actual quarterly investments in:
- extraction of oil and gas, pipeline, mining, manuf. and electricity supply
- extraction of oil and gas and pipeline transport
- manufacturing, mining & quarrying and electricity supply
- manufacturing, mining & quarrying
- manufacturing
- mining & quarrying
- electricity supply
Pre-treatment routines/schemes
Pre-treatment is an adjustment for variations caused by calendar effects and outliers.
Automatic pre-treatment of raw data based on standard options in the seasonal adjustment tools.
Calendar adjustment
Calendar adjustment involves adjusting for the effects of working days/trading days and for moving holidays. Working days/trading days are adjustment for both the number of working days/trading days and for that the composition of days can vary from one month to another.
Calendar adjustments are performed on all time series showing significant and plausible calendar effects within a statistically robust approach such as regression or RegARIMA (a regression model with an ARIMA structure for the residuals).
Methods for trading/working day adjustment
RegARIMA correction. The effect of trading days is estimated in a RegArima framework.
The effect of trading days is estimated by using a correction for the length of the month and for leap year before regressing the series on the number of working days. The residuals will have an ARIMA-structure.
Correction for moving holidays
Automatic correction. If performed by X-12-ARIMA, automatic correction of raw data will be based on US holidays.
National and EU/euro area calendars
Use of default calendars. The default in X-12-ARIMA is the US calendar.
Treatment of outliers
Outliers, or extreme values, are abnormal values of the series.
Outliers are detected automatically by the seasonal adjustment tool. The outliers are removed before seasonal adjustment is carried out and then reintroduced into the seasonally adjusted data.
Model selection
Pre-treatment requires choosing an ARIMA model, as well as deciding whether the data should be log-transformed or not.
Automatic model selection by established routines in the seasonal adjustment tool.
Decomposition scheme
The decomposition scheme specifies how the various components – basically trend-cycle, seasonal and irregular – combine to form the original series. The most frequently used decomposition schemes are the multiplicative, additive or log additive.
Manual decomposition scheme selection after graphical inspection of the time series.
Choice of seasonal adjustment approach
X-12-ARIMA
Consistency between raw and seasonally adjusted data
In some series, consistency between raw and seasonally adjusted series is imposed.
Do not apply any constraint.
Consistency between aggregate/definition of seasonally adjusted data
In some series, consistency between seasonally adjusted totals and the aggregate is imposed .For some series there is also a special relationship between the different series, e.g. GDP which equals production minus intermediate consumption.
Do not apply any constraint.
Direct versus indirect approach
Direct seasonal adjustment is performed if all time series, including aggregates, are seasonally adjusted on an individual basis. Indirect seasonal adjustment is performed if the seasonally adjusted estimate for a time series is derived by combining the estimates for two or more directly adjusted series.
Direct seasonal adjustment is performed on aggregates and components using the same approach and software. Any discrepancies across the aggregation structure are not removed.
Horizon for estimating the model and the correction factors
When performing seasonal adjustment of a time series, it is possible to choose the period to be used in estimating the model and the correction factors. Correction factors are the factors used in the pre-treatment and seasonal adjustment of the series.
The whole time series is used to estimate the model and the correction factors
General revision policy
Seasonally adjusted data may change due to a revision of the unadjusted (raw) data or the addition of new data. Such changes are called revisions, and there are several ways to deal with the problem of revisions when publishing the seasonally adjusted statistics.
Seasonally adjusted data are revised in accordance with a well-defined and publicly available revision policy and release calendar.
Concurrent versus current adjustment
The model, filters, outliers and regression parameters are re-identified and re-estimated continuously as new or revised data become available.
Horizon for published revisions
The revision period for the seasonally adjusted results is limited to 3-4 years prior to the revision period of the unadjusted data, while older data are frozen.
Comment: The revision period for the seasonally adjusted figures is 4 years when new data are added. The whole time series may be revised when implementing new or improved methods.
Evaluation of seasonally adjustment data
Continuous/periodical evaluation using standard measures proposed by different seasonal adjustment tools.
Quality measures for seasonal adjustment
For most of the series, a selected set of diagnostics and graphical facilities for bulk treatment of data is used.
A table containing selected quality indicators for the seasonal adjustment is available here .
For more information on the quality indicator in the table see: metadata on methods: seasonal adjustment
Seasonal adjustment of short time series
All series are sufficiently long to perform an optimal seasonal adjustment.
Treatment of problematic series
None of the published series are viewed as problematic.
Data availability
Unadjusted and seasonally adjusted data are available.
Press releases
In addition to unadjusted data, at least one of the following series is released: Calendar adjusted, seasonally adjusted, smoothed seasonally adjusted (trend).

Analyses, articles and publications
 Article / 16 November 2023Sharply up-adjusted estimates for oil investments in 2024Total investments in oil and gas activity in 2024, including pipeline transportation, are estimated at NOK 232 billion. This is NOK 25.3 billion more than estimated in the previous quarter. The estimate for 2023 is now NOK 216 billion.
 Article / 25 May 2023Oil investment estimate for 2023 upward adjustedTotal investments in oil and gas activity in 2023, including pipeline transportation, are estimated at NOK 197.8 billion, which is 5.3 per cent higher than estimated in the previous quarter.
 Article / 17 November 2022Increased estimates for oil investments in 2023Total investments in oil and gas activity in 2023, including pipeline transportation, are estimated at NOK 149.7 billion. This is NOK 14.4 billion more than estimated in the previous quarter. The estimate for 2022 is now NOK 175.3 billion.
- Article / 27 May 2022Oil investment estimate for 2022 upward adjustedTotal investments in oil and gas activity in 2022, including pipeline transportation, are estimated at NOK 167.2 billion, which is 4.8 per cent higher than estimated in the previous quarter.
 Article / 17 February 2022Oil investment estimate for 2022 upward adjustedTotal investments in oil and gas activity in 2022, including pipeline transportation, are estimated at NOK 159.5 billion, which is 3.3 per cent higher than estimated in the previous quarter.
 Article / 19 August 2021Substantial investment drop in electricity supplyThe companies’ latest investment estimates for 2021 indicate a decline within oil and gas, manufacturing, mining and quarrying and electricity supply. For 2022 the newest estimates also suggest a decrease in total investments. Falling investments within electricity supply contribute most to the decline for both years.